FinOps tied to the graph.
Connect cost signals to infrastructure reality — idle resources, oversized fleets, and budget risk — then act with guarded automation.
Eliminated
Waste
Enforced
Budgets
Accurate
Forecasts
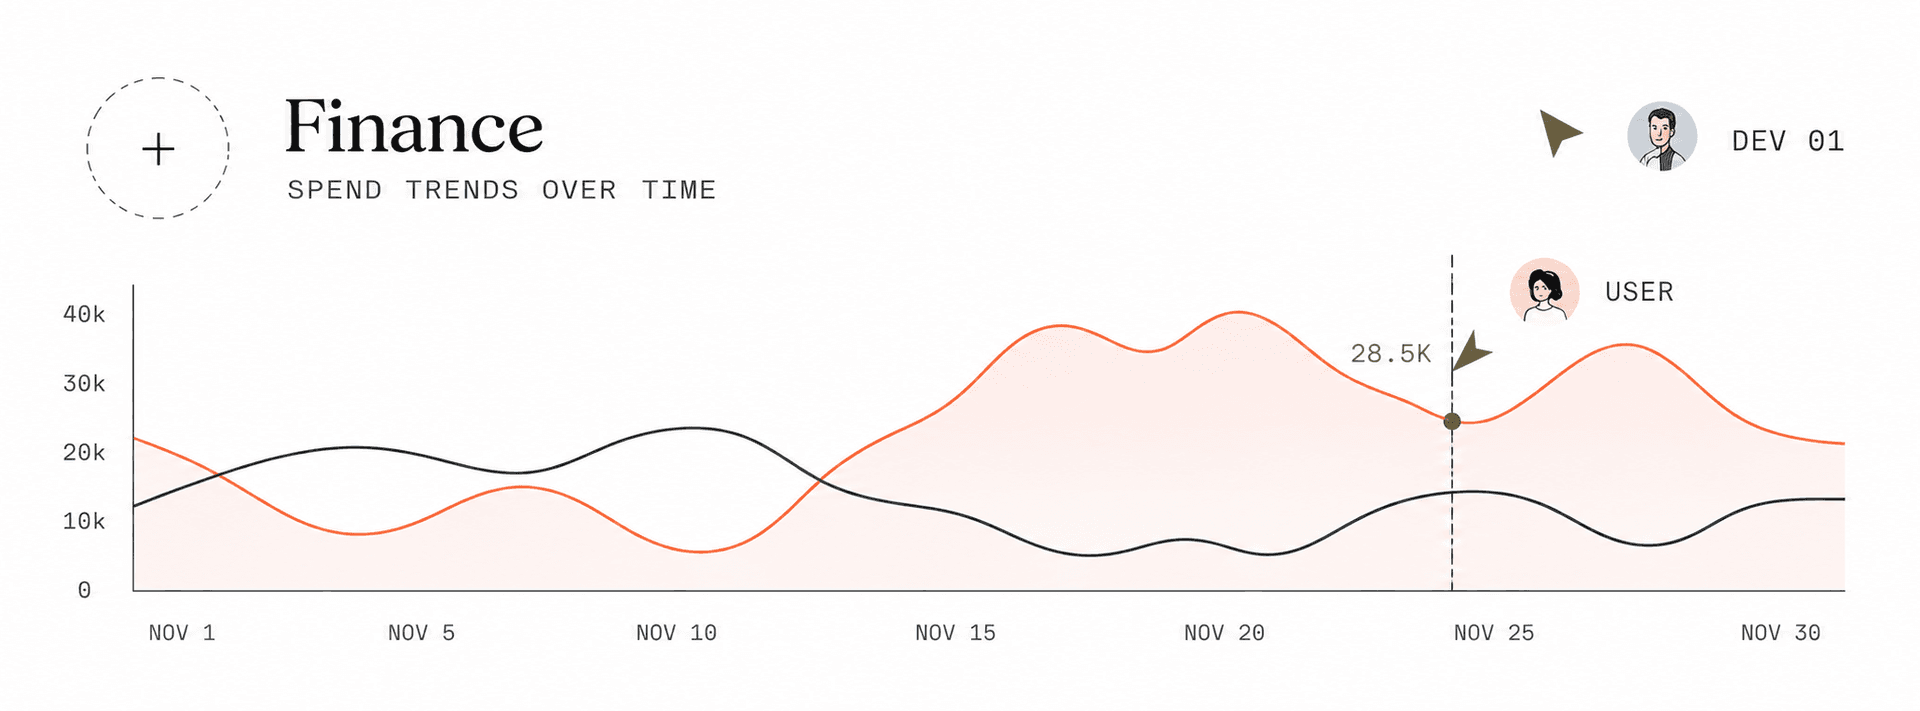
Actual spend vs optimized
Rightsizing, waste detection, forecasting, and savings analytics across every cloud bill.
Idle & zombie
Over-provisioned
Orphaned storage
Uncommitted spend
Everything in FinOps
One operating loop from cloud bill to guarded action on the infrastructure graph.
Cloud cost optimization
Continuous spend analysis across every provider.
Rightsizing
Matches instance size to actual workload.
Waste detection
Flags idle, orphaned, and unused resources.
Idle resources
Surfaces fleets running below utilization.
Cost forecasting
Predicts spend before the bill arrives.
Savings analytics
Tracks realized savings against baseline.
Budget monitoring
Alerts before teams breach spend limits.
Cloud spend intelligence
Correlates cost with the infrastructure graph.
Replace half your infrastructure stack with one AI operating system.
Enterprise ready from day one. A category defining intelligence layer meticulously engineered for the complexity of Fortune scale cloud operations.
AWS, Azure, Google Cloud, Kubernetes, Terraform, Datadog & more